Multi-Color Graph Visualization: Creating Vibrant Network Diagrams
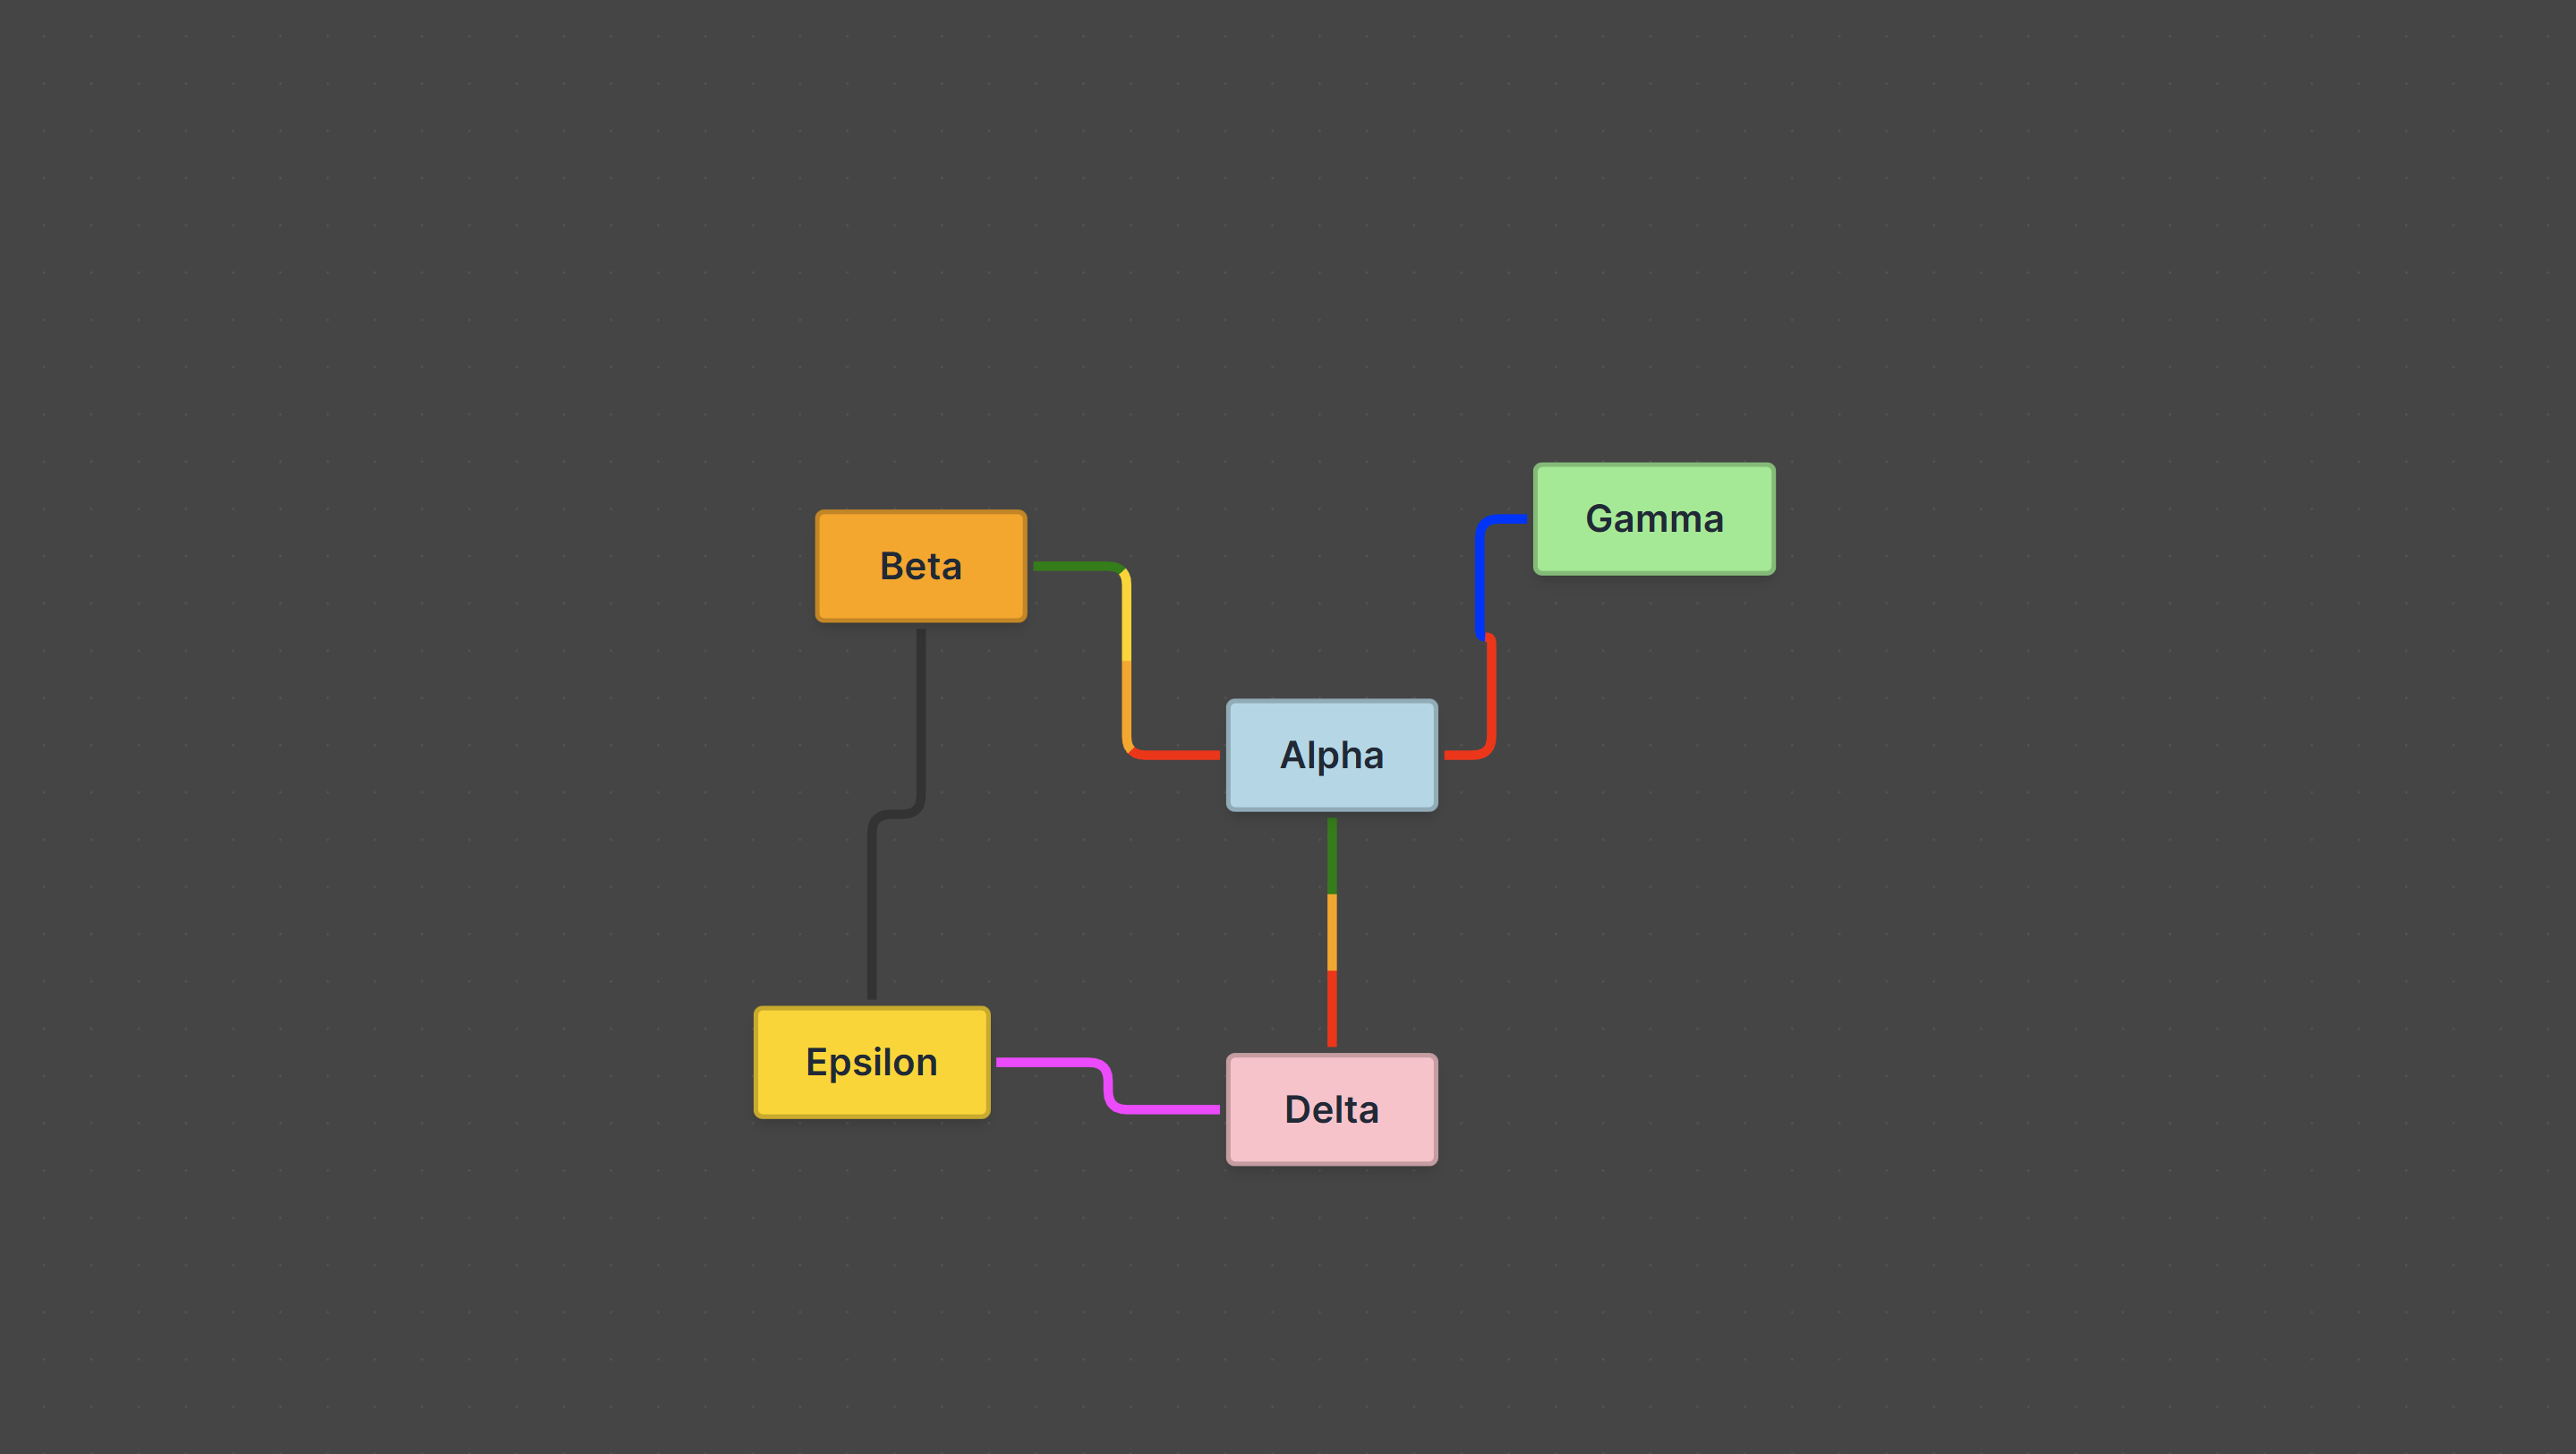
Multi-Color Graph Visualization is a sophisticated solution for creating vibrant, visually distinct network diagrams with advanced color management capabilities. This tool enables you to color-code nodes based on categories, status, data attributes, or any custom classification system, making complex graphs immediately understandable at a glance.
The Power of Color in Data Visualization
Color is one of the most powerful tools in data visualization. Different colors help users:
- Quickly identify patterns in complex data
- Group related nodes visually
- Distinguish between node types without reading labels
- Understand data relationships through color associations
- Navigate large graphs more efficiently
This solution provides comprehensive color management tools including predefined color palettes, custom color schemes, gradient support, and interactive color pickers.
Key Features
Multi-Color Node System
Each node can be assigned colors based on its properties, allowing for dynamic color coding that reflects real-time data changes. The system supports multiple color assignment strategies:
- Category-based coloring: Assign colors by node category or type
- Status-based coloring: Color nodes by status (active, inactive, pending, etc.)
- Value-based gradients: Use color gradients to represent numeric values
- Custom color mapping: Define custom color rules based on any node attribute
// Example: Color assignment based on node category
const colorMap = {
  'user': '#3B82F6',      // Blue for users
  'product': '#10B981',   // Green for products
  'order': '#F59E0B',     // Orange for orders
  'payment': '#EF4444',   // Red for payments
};

nodes.forEach(node => {
  node.style = {
    background: colorMap[node.category] || '#6B7280',
    color: '#FFFFFF',
    border: `2px solid ${colorMap[node.category] || '#6B7280'}`,
  };
});
Color Coding Strategies
The solution supports various color coding strategies:
Category-Based Coloring
Assign distinct colors to different node categories. This is ideal for visualizing different types of entities in a network.
// Example: Category-based color coding
function assignCategoryColors(nodes) {
  const categories = [...new Set(nodes.map(n => n.category))];
  const palette = generateColorPalette(categories.length);

  nodes.forEach(node => {
    const categoryIndex = categories.indexOf(node.category);
    node.color = palette[categoryIndex];
  });
}
Status-Based Coloring
Use colors to represent node status, making it easy to see which nodes are active, inactive, pending, or in error states.
// Example: Status-based color coding
const statusColors = {
  'active': '#10B981',    // Green
  'inactive': '#6B7280',  // Gray
  'pending': '#F59E0B',   // Orange
  'error': '#EF4444',     // Red
};
Value-Based Gradients
Create color gradients that represent numeric values, such as node importance, connection count, or any metric.
// Example: Value-based gradient
function assignGradientColors(nodes, valueKey) {
  const values = nodes.map(n => n[valueKey]);
  const min = Math.min(...values);
  const max = Math.max(...values);

  nodes.forEach(node => {
    const normalized = (node[valueKey] - min) / (max - min);
    node.color = interpolateColor('#3B82F6', '#EF4444', normalized);
  });
}
Custom Themes
The solution includes several built-in color themes optimized for different use cases:
- Accessibility-focused palettes: High contrast colors for accessibility compliance
- Vibrant themes: Eye-catching colors for presentations
- Professional themes: Subtle, professional colors for reports
- Brand themes: Customizable themes that match your brand
// Example: Theme configuration
const themes = {
  vibrant: {
    primary: '#3B82F6',
    secondary: '#10B981',
    accent: '#F59E0B',
    danger: '#EF4444',
  },
  professional: {
    primary: '#1F2937',
    secondary: '#4B5563',
    accent: '#6B7280',
    danger: '#DC2626',
  },
  accessible: {
    primary: '#0000FF',
    secondary: '#008000',
    accent: '#FF8C00',
    danger: '#FF0000',
  },
};
Gradient Edges
Style edges with colors and gradients to represent:
- Relationship types: Different colors for different relationship types
- Connection strength: Gradient intensity based on connection weight
- Data flow direction: Color gradients showing flow direction
- Status: Edge colors reflecting connection status
// Example: Gradient edge styling
edges.forEach(edge => {
  edge.style = {
    stroke: edge.relationshipType === 'strong' ? '#10B981' : '#6B7280',
    strokeWidth: edge.weight || 2,
  };

  // Gradient for directional flow
  if (edge.directional) {
    edge.style.stroke = `url(#gradient-${edge.id})`;
  }
});
Interactive Color Picker
Real-time color selection and adjustment tools provide immediate visual feedback for fine-tuning your visualization. Users can:
- Select colors from predefined palettes
- Use color pickers for custom colors
- Adjust color saturation and brightness
- Preview color changes in real-time
- Save custom color schemes
Implementation Details
Color Management System
The color management system provides:
- Color Palette Generation: Automatically generate harmonious color palettes
- Color Accessibility: Ensure sufficient contrast for readability
- Color Blind Support: Palettes optimized for color vision deficiencies
- Theme Management: Save, load, and share color themes
- Dynamic Updates: Update colors based on real-time data changes
// Example: Color palette generation
function generateColorPalette(count) {
  const palette = [];
  const hueStep = 360 / count;

  for (let i = 0; i < count; i++) {
    const hue = i * hueStep;
    palette.push(`hsl(${hue}, 70%, 50%)`);
  }

  return palette;
}
Performance Optimization
For large graphs with many colored nodes:
- Color caching: Cache computed colors to avoid recalculation
- Batch updates: Update colors in batches for better performance
- Lazy rendering: Only render visible nodes with full color details
- Web Workers: Offload color calculations to background threads
Use Cases
Category-Based Data Visualization
Visualize data with multiple categories, such as different types of users, products, or entities. Color coding makes it easy to distinguish between categories at a glance.
Status Tracking Dashboards
Create monitoring dashboards where node colors represent status (online, offline, warning, error). This enables quick identification of issues and system health.
Multi-Dimensional Data Exploration
Explore data with multiple dimensions by using different color attributes. For example, use color for category and node size for value.
Branded Visualizations
Create visualizations that match your brand colors and design guidelines. Custom themes ensure consistency across all visualizations.
Accessibility-Focused Design
Use accessibility-optimized color palettes to ensure your visualizations are usable by people with color vision deficiencies.
Benefits
- Instant Understanding: Instantly understand complex data through strategic color coding
- Visual Appeal: Create visually appealing, professional visualizations
- Improved Comprehension: Improve data comprehension by 80% with strategic color use
- Flexibility: Support multiple color themes for different contexts
- Accessibility: Accessible color palettes for inclusive design
- Time Savings: Save design time with pre-built color schemes
Technical Implementation
The solution is built with:
- React: Modern UI framework for interactive components
- TypeScript: Type-safe development for reliability
- ReactFlow: Powerful graph visualization library
- Color Management: Advanced color calculation and management system
- Canvas API: High-performance rendering for large graphs
- SVG: Scalable vector graphics for crisp colors at any zoom level
Integration
The Multi-Color Graph Visualization solution can be integrated into:
- React and Next.js applications
- Vue and Angular projects
- Data visualization dashboards
- Business intelligence tools
- Network monitoring systems
Export colored graphs to PNG, SVG, PDF formats with color preservation. Import color schemes from design tools like Figma or Sketch. Compatible with color management systems and design tokens. API available for programmatic color assignment and theme management.
Best Practices
Color Selection
- Use distinct colors: Ensure colors are easily distinguishable
- Limit palette size: Use 5-7 colors for optimal clarity
- Consider accessibility: Test with color blindness simulators
- Maintain consistency: Use consistent colors across related visualizations
- Use semantic colors: Red for errors, green for success, etc.
Color Coding
- Group related items: Use similar colors for related categories
- Use gradients wisely: Gradients work well for continuous values
- Avoid color overload: Don't use too many colors simultaneously
- Provide legends: Always include color legends for clarity
- Test readability: Ensure text is readable on colored backgrounds
Conclusion
Multi-Color Graph Visualization provides a powerful solution for creating vibrant, informative network diagrams. By leveraging strategic color coding, you can transform complex data into immediately understandable visualizations that reveal patterns, relationships, and insights at a glance.
Whether you're building dashboards, analyzing networks, or presenting data, the right color strategy can make all the difference in comprehension and engagement.
Start creating stunning multi-color graph visualizations today!


