React Flow Periodic Table — Make Chemistry Interactive, Visual, and Easier to Explore
Pro
About React Flow Periodic Table — Make Chemistry Interactive, Visual, and Easier to Explore
React Flow Periodic Table transforms the traditional periodic table into an interactive learning and visualization experience. Built with React Flow, it brings chemical elements, atomic structures, animated Bohr models, and element comparisons into one visual workspace.
React Flow Periodic Table—Make Chemistry Interactive, Visual, and Easier to Explore
Chemistry is full of information: 118 chemical elements, atomic numbers, symbols, atomic masses, electron configurations, and relationships between different groups of elements.
Traditional periodic tables are useful, but they often limit how students and educators interact with this information.
React Flow Periodic Table transforms the traditional periodic table into an interactive learning and visualization experience. Built with React Flow, it brings chemical elements, atomic structures, animated Bohr models, and element comparisons into one visual workspace.
Whether you're creating educational software, developing a chemistry learning platform, or building an interactive scientific visualization tool, this example provides a practical foundation for presenting chemistry in a more engaging way.
Explore All 118 Chemical Elements in One Interactive Workspace
The application brings all 118 chemical elements into a structured, interactive periodic table.
Users can explore elements, discover essential information, and navigate different categories without constantly switching between reference materials.
Hovering over an element provides quick access to its facts, making it easier to explore chemical information directly from the table.
The interface also provides dedicated visualization modes:
- Periodic Table: Explore all 118 elements in their familiar periodic arrangement.
- Atomic Structure: Examine the structure of individual atoms.
- Animated Table: Explore animated atomic representations.
- Compare: View different elements side by side.
This makes the application more than a digital periodic table. It becomes an interactive environment for exploring chemical information.
Why Choose React Flow Periodic Table?
1. Make Chemistry More Engaging
Learning chemical elements through static tables and written descriptions can become repetitive.
An interactive periodic table creates a more engaging experience by allowing users to explore elements directly, discover information on demand, and investigate atomic structures visually.
Students can move beyond memorising element names and symbols to exploring how atoms are structured.
2. Explore Atomic Structures Visually
Understanding atomic structure is an important part of learning chemistry.
The application includes animated Bohr atomic models with electron shells, helping users visualise how electrons are arranged around an atomic nucleus.
Instead of relying entirely on textbook illustrations, learners can explore atomic representations through an interactive interface.
3. Compare Chemical Elements Side by Side
Understanding the differences between elements is easier when their properties can be examined together.
The element comparison feature allows users to compare selected elements side by side.
This is particularly useful for studying differences in atomic numbers, atomic masses, and other available element information.
4. Navigate Elements by Category
The periodic table organizes elements into meaningful groups.
The application includes category-based exploration, making it easier to focus on specific families of elements.
Categories include:
- Metals
- Nonmetals
- Alkali Metals
- Alkaline Earth Metals
- Transition Metals
- Post-transition Metals
- Metalloids
- Halogens
- Noble Gases
- Lanthanides
- Actinides
This helps users explore related elements without having to search through the entire table manually.
5. Create and Export Chemistry Diagrams
The application supports customization, saving, and exporting chemistry diagrams.
This makes it useful not only for exploring existing chemical information but also for creating visual materials that can be reused in educational and scientific contexts.
Real-World Applications
1. Schools and Classroom Learning
Teachers can use an interactive periodic table to introduce chemical elements and explain the structure of atoms.
For example, during a lesson about atomic structure, a teacher can select hydrogen, carbon, oxygen, or sodium and explore the corresponding atomic model.
Students can then investigate how electron arrangements differ between elements.
How it helps: Lessons become more visual and interactive, helping students connect theoretical chemistry concepts with visual representations.
2. University Chemistry Education
University students often need to understand relationships between chemical elements, atomic structure, and periodic properties.
The element comparison feature can support classroom demonstrations, study sessions, and individual learning.
For example, students can compare elements from different groups to investigate how their properties differ.
How it helps: Students can explore chemical information in one place rather than repeatedly switching between textbooks, reference websites, and separate diagrams.
3. Online Chemistry Learning Platforms
EdTech companies can use an interactive periodic table as part of a larger digital learning platform.
It can serve as a dedicated chemistry module where learners explore elements, inspect atomic structures, and compare chemical properties.
How it helps: An interactive experience can make a digital chemistry course more engaging and provide learners with a convenient visual reference.
4. Science Presentations and Educational Content
Science educators, content creators, and academic presenters often need clear visual materials to explain chemical concepts.
The ability to customize, save, and export chemistry diagrams makes the application useful for preparing supporting visual content.
How it helps: Educators can create and reuse visual chemistry materials instead of manually recreating diagrams for every presentation.
5. Chemistry Reference and Information Tools
Developers can use the example as a foundation for building web-based chemistry reference applications.
For example, a scientific information platform could provide an interactive element explorer where users inspect individual elements and examine their atomic structures.
How it helps: Developers gain a starting point for building a specialized chemistry interface rather than designing every visualization component from scratch.
6. Interactive Science Demonstrations
Museums, science exhibitions, and educational demonstrations can benefit from interactive visual explanations.
A periodic table displayed on a large screen or touchscreen can allow visitors to explore different elements and discover their atomic structures.
How it helps: Visitors can learn through direct interaction, making scientific information more approachable and memorable.
How React Flow Periodic Table Makes Learning Easier
Traditional periodic tableInteractive periodic table
Read element information from a static reference
Explore element facts directly
Rely on printed atomic diagrams
Examine animated Bohr models
Compare elements manually
Compare selected elements side by side
Search through long reference materials
Explore elements by category
Create chemistry illustrations separately
Customize, save, and export diagrams
The biggest advantage is bringing multiple chemistry exploration experiences together in one interface.
Students can explore the periodic table, investigate atomic structures, and compare elements without constantly moving between different resources.
Who Can Benefit from React Flow Periodic Table?
Students — Explore chemical elements, atomic structures, and periodic table categories through interactive visualizations.
Chemistry teachers — Make classroom explanations more engaging with visual atomic models and element comparisons.
University educators — Support chemistry lessons and demonstrations with interactive scientific content.
EdTech developers — Build chemistry learning platforms and interactive educational applications.
Science content creators — Prepare visual chemistry materials for presentations, tutorials, and educational content.
Frontend developers — Explore how React Flow can support scientific visualization interfaces and interactive data applications.
SaaS founders — Use the example as inspiration for building specialized scientific learning and reference products.
Why Buy React Flow Periodic Table from VisualFlow?
Building an interactive periodic table from scratch involves much more than arranging element cards in a grid.
Developers need to work with structured element data, interactive visual components, atomic representations, comparison interfaces, and a consistent user experience across multiple visualization modes.
Creating these foundations takes time, particularly when the goal is to deliver a polished educational application.
React Flow Periodic Table gives developers a practical starting point for building interactive chemistry and scientific visualization experiences.
By studying and adapting this example, developers can spend less time creating common interface patterns and more time developing the educational or scientific features that make their applications unique.
It is particularly useful if you're:
- Building a chemistry learning application.
- Developing an interactive periodic table.
- Creating educational science software.
- Building a scientific data visualization platform.
- Designing interactive atomic structure demonstrations.
- Exploring React Flow for non-traditional data visualization projects.
Rather than starting with an empty canvas, you can use an existing visual implementation as a foundation for your next project.
Build Better Educational Experiences with VisualFlow
Chemistry becomes easier to explore when information is presented in a way that encourages curiosity.
React Flow Periodic Table combines the familiar structure of the periodic table with interactive element exploration, animated atomic models, and side-by-side comparisons.
Whether you're developing an educational platform, a scientific reference tool, or an interactive chemistry application, this example demonstrates how React Flow can bring complex scientific information into a more accessible visual experience.
Explore React Flow Periodic Table by VisualFlow and bring chemistry to life through interactive visualization.
Discover more interactive React Flow examples and development resources at VisualFlow.
Key Features & Capabilities
Architecture & Technologies
Related Blueprints
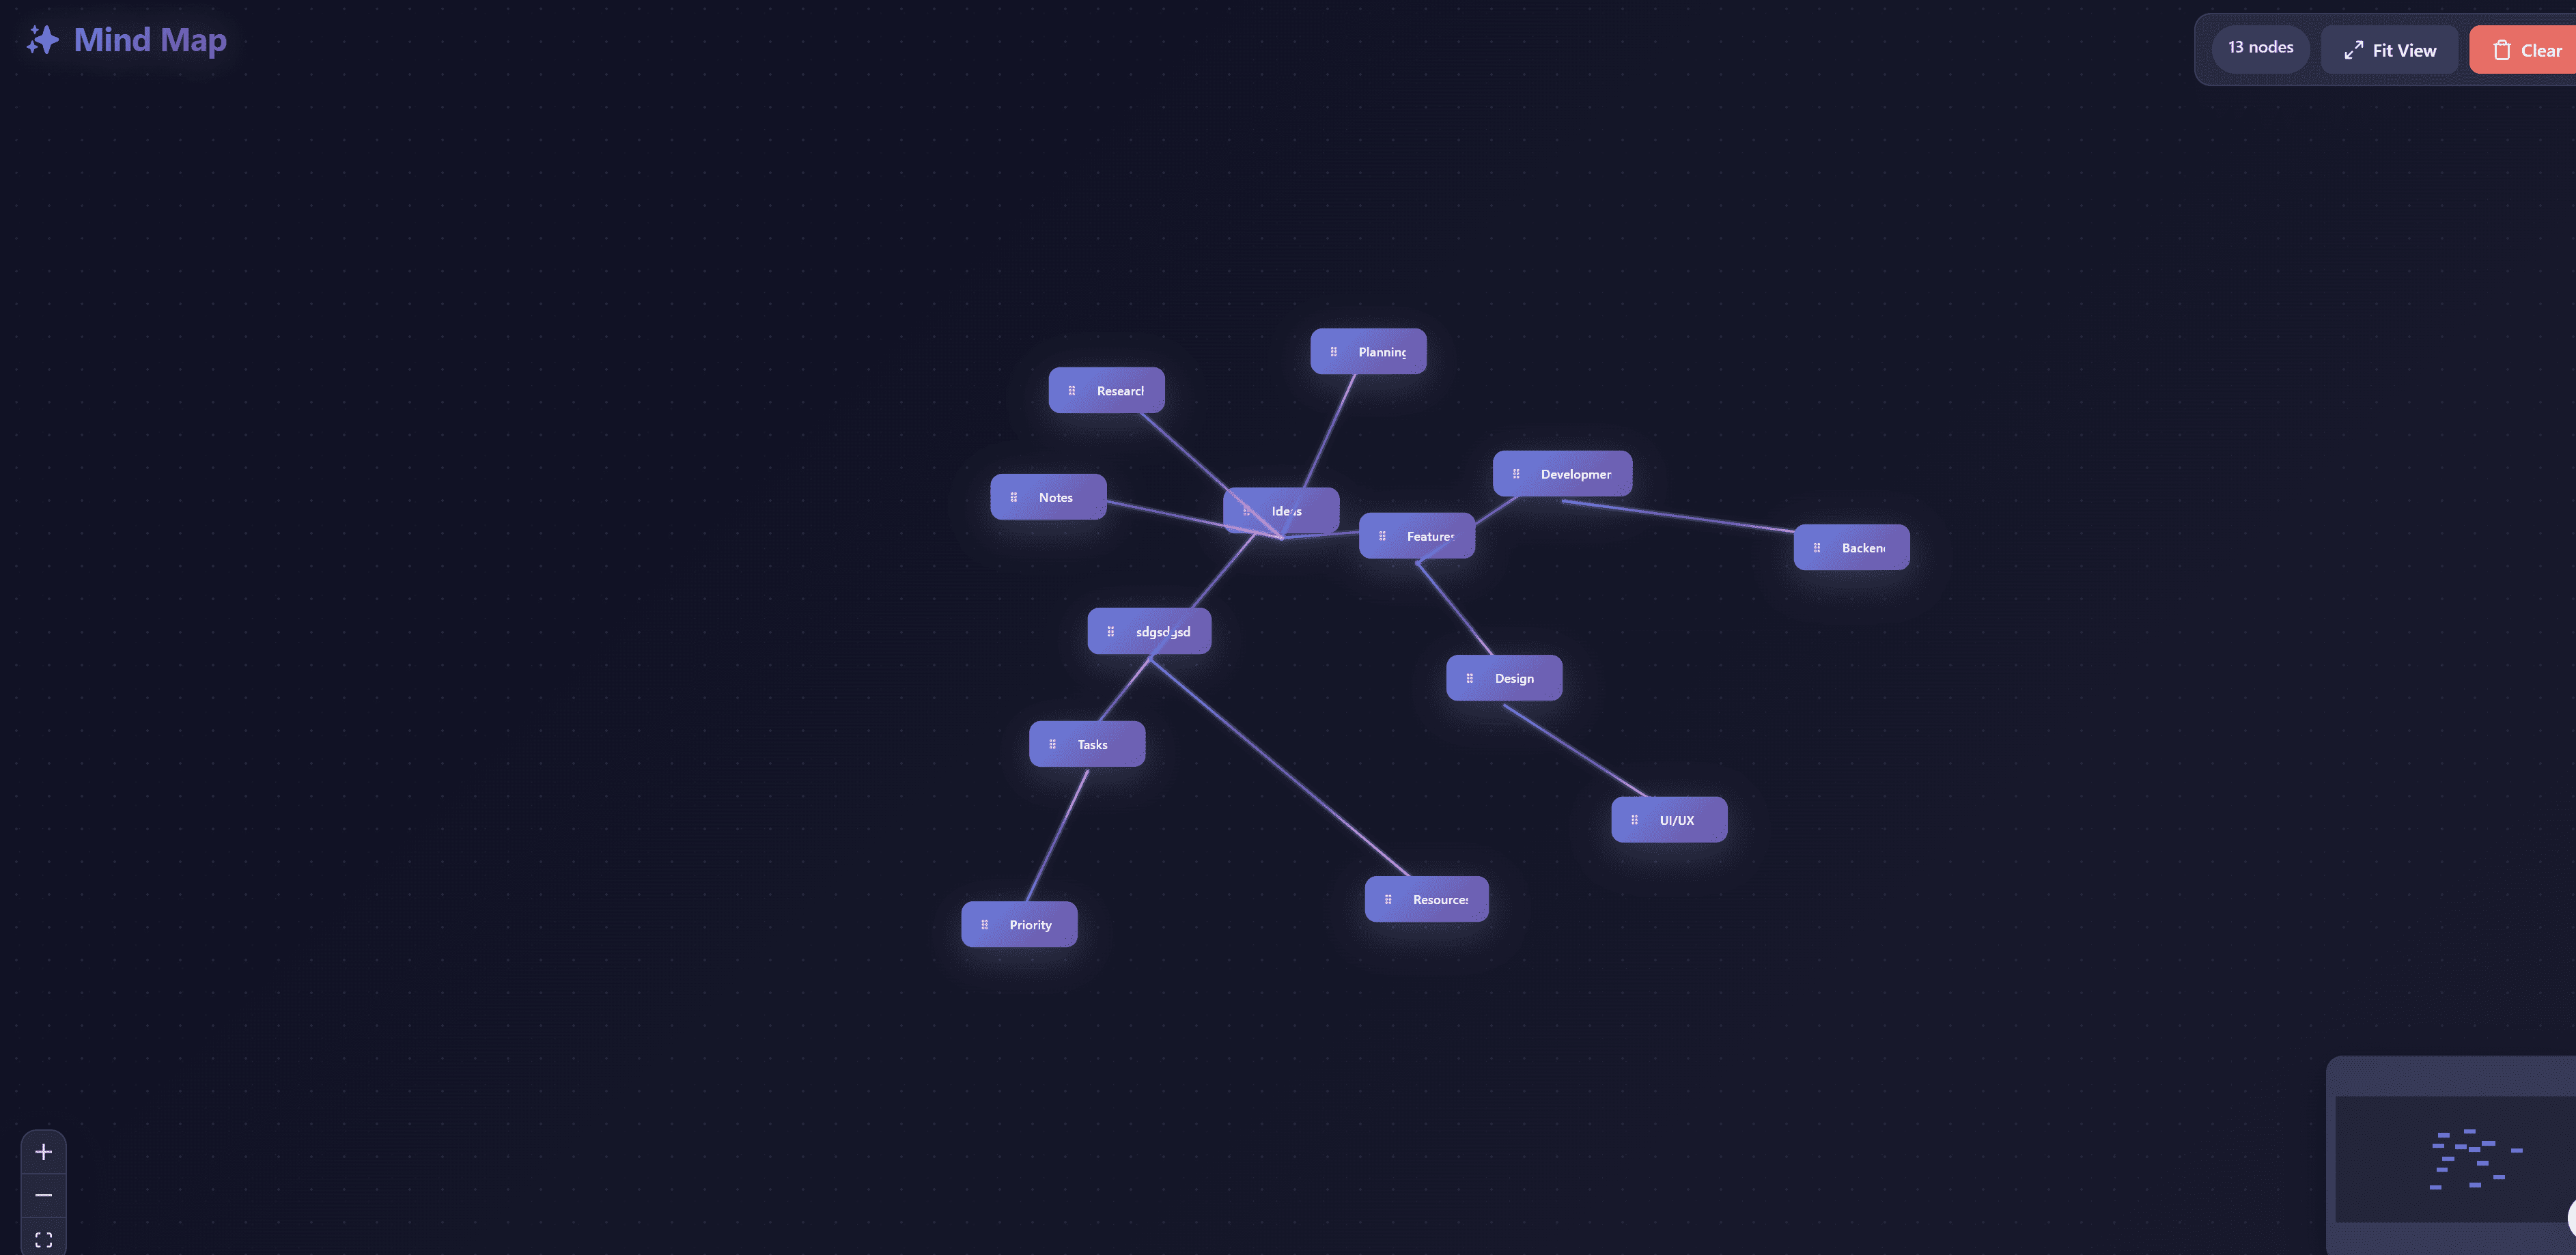
React flow concept map
Interactive concept mapping tool for organizing knowledge and visualizing relationships between ideas. Create hierarchical concept maps with drag-and-drop nodes, custom connections, and rich text editing. Perfect for education, research, brainstorming, and knowledge management with intuitive interface for building complex conceptual relationships.
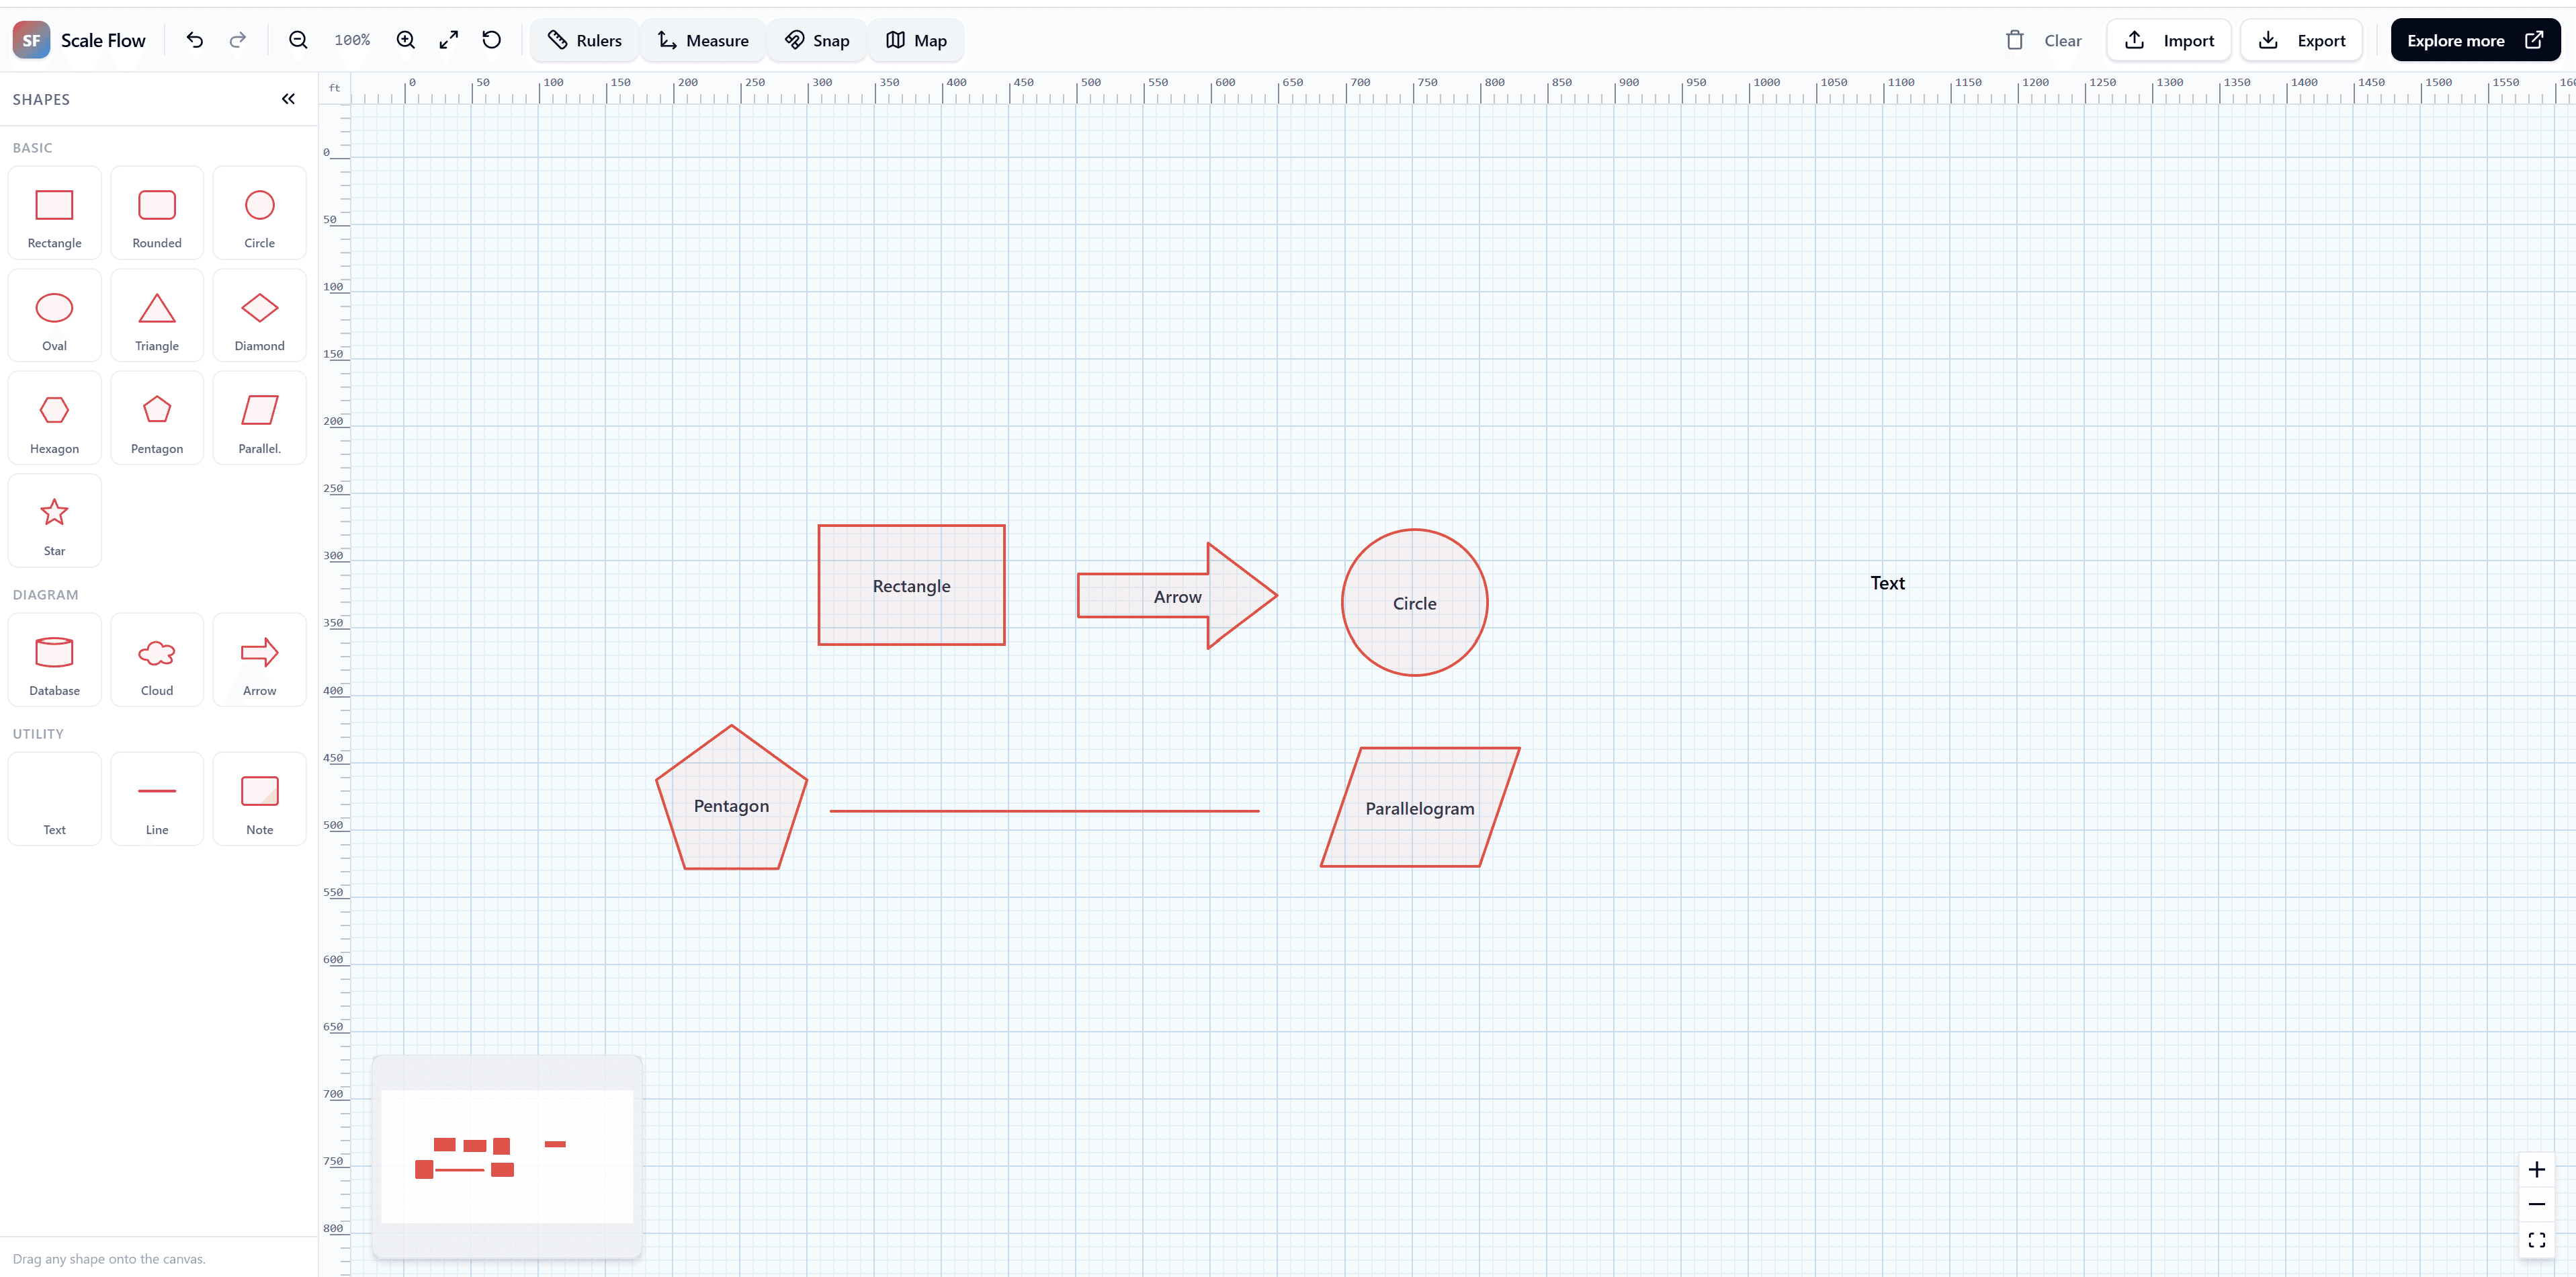
Scale Studio Pro Enterprise with React flow
An enterprise-grade, massive scale diagramming studio built with React Flow. Engineered for performance with thousands of nodes, advanced minimap navigation, and high-fidelity zoom.
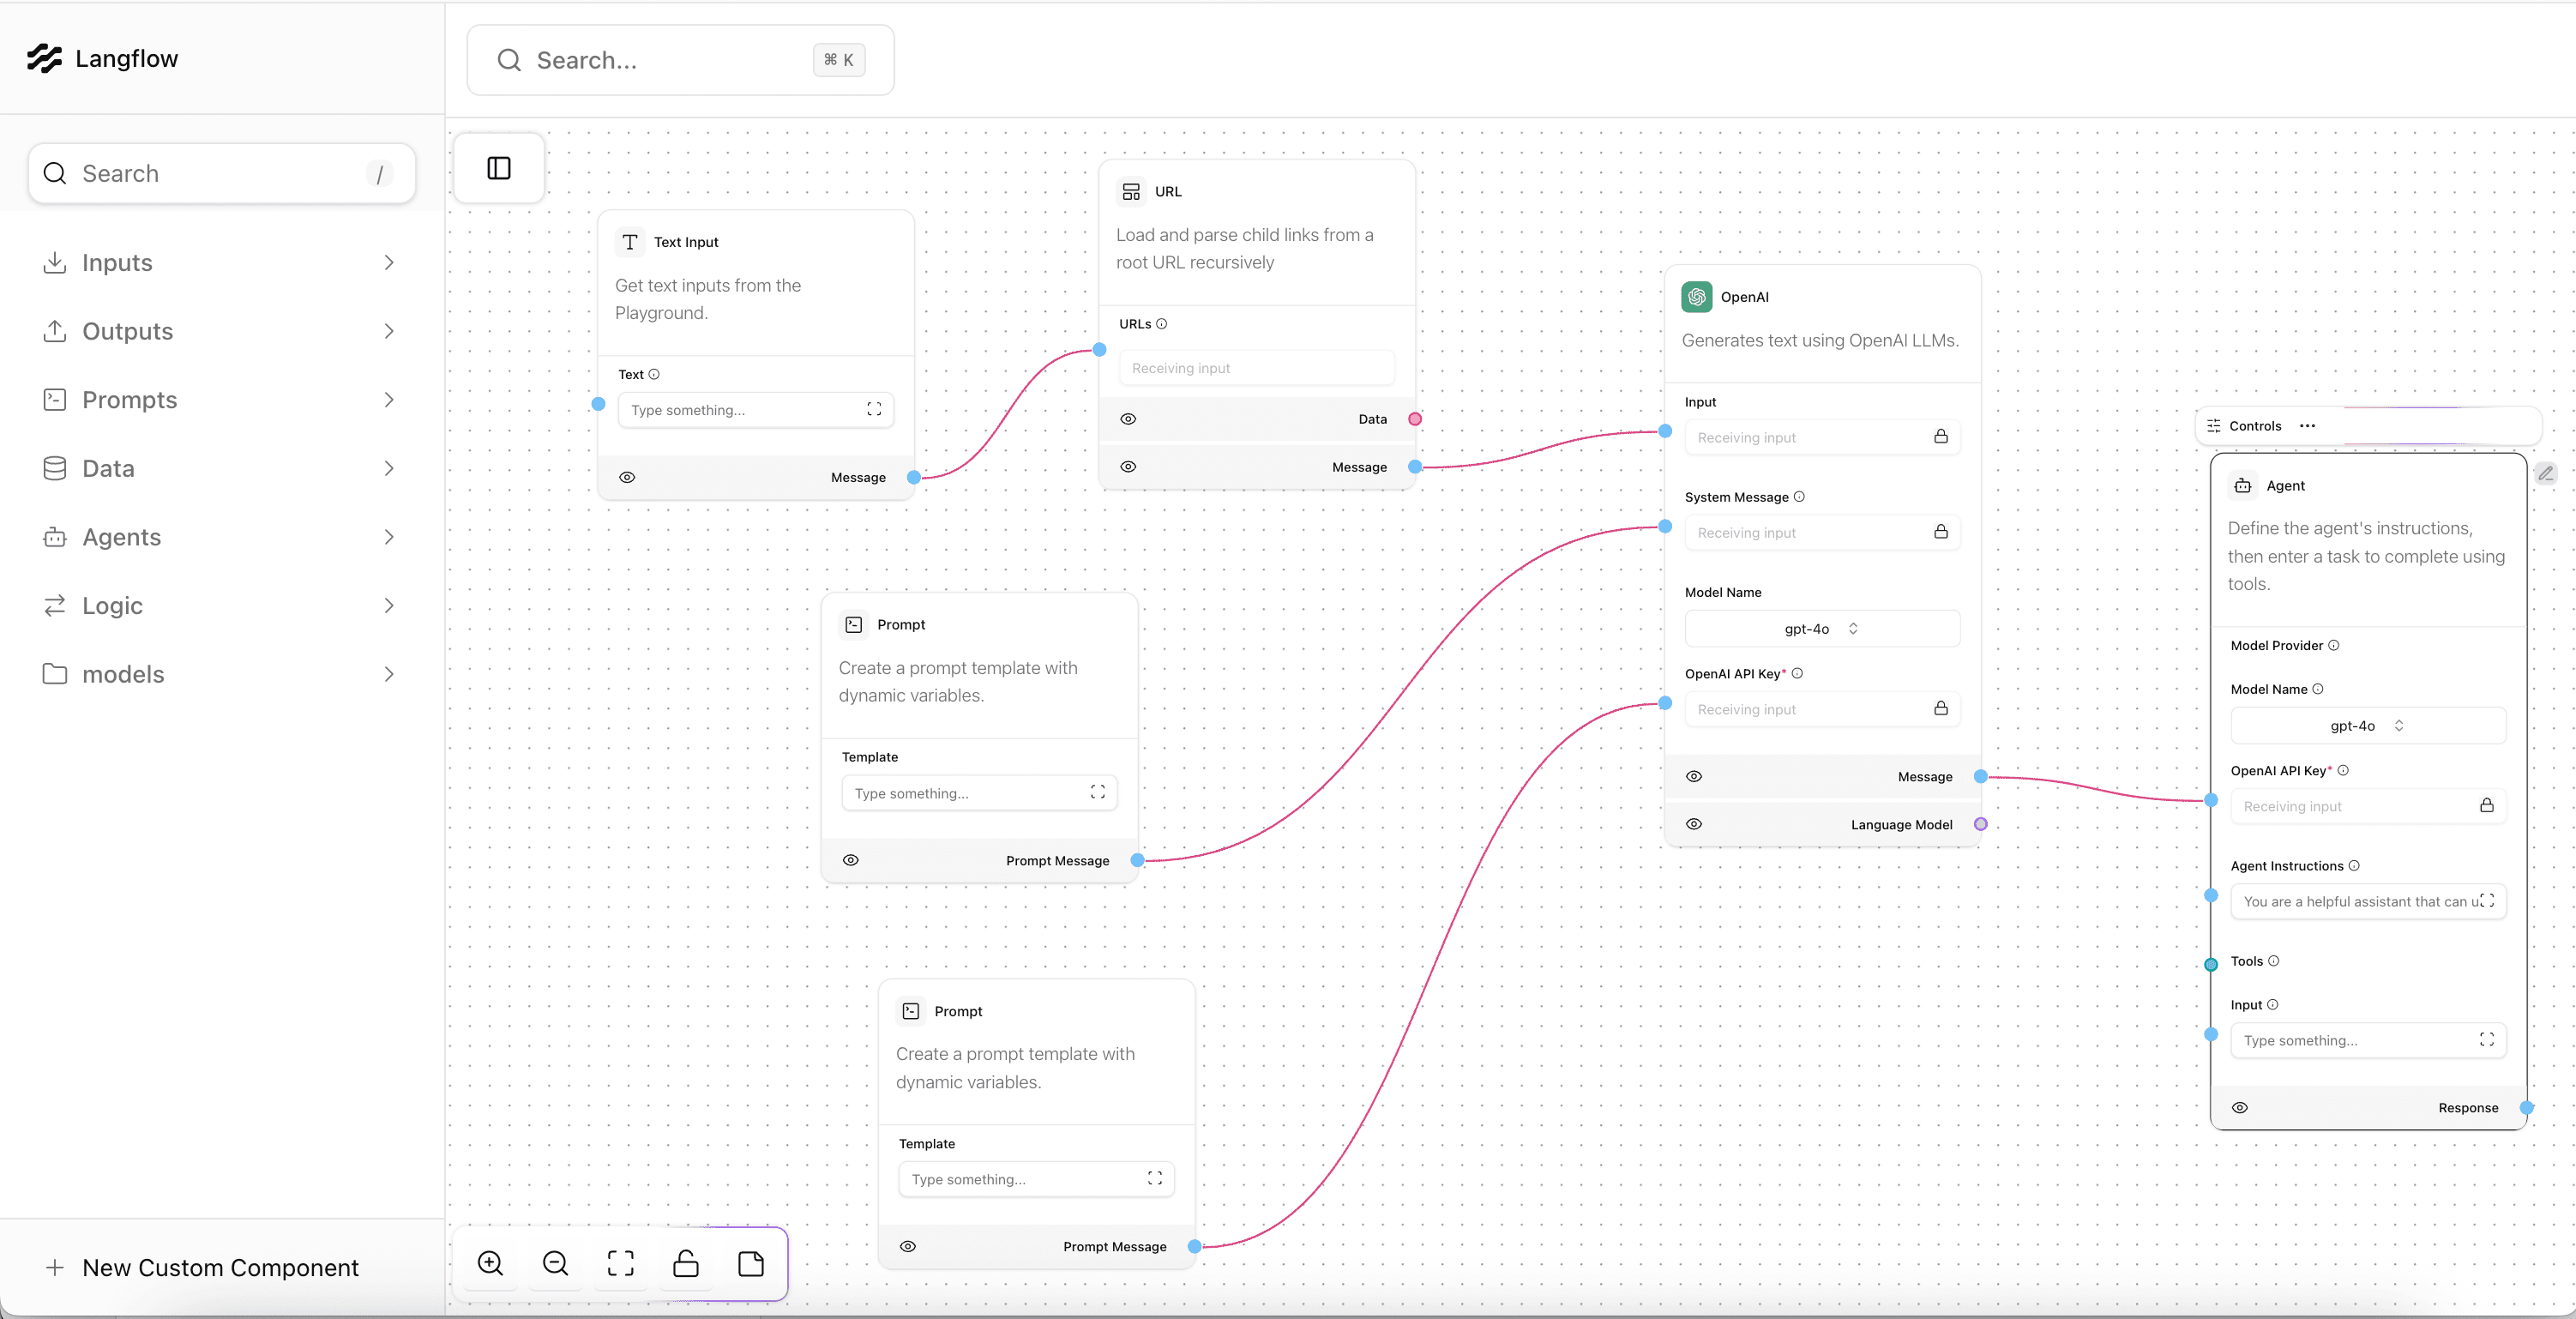
React flow Langflow builder
Langflow is a low-code AI application builder that enables developers to create sophisticated AI workflows, agents, and retrieval-augmented generation (RAG) applications without extensive coding. Build and deploy LLM-powered applications through intuitive visual interface with support for all major large language models, vector databases, and growing library of AI tools. Features prompt templating, model comparison, vector database integration, and production deployment tools for building AI chatbots, content generation systems, and complex reasoning agents.