ReactFlow Pipeline Flow: Visualizing Data Pipelines and ETL Processes
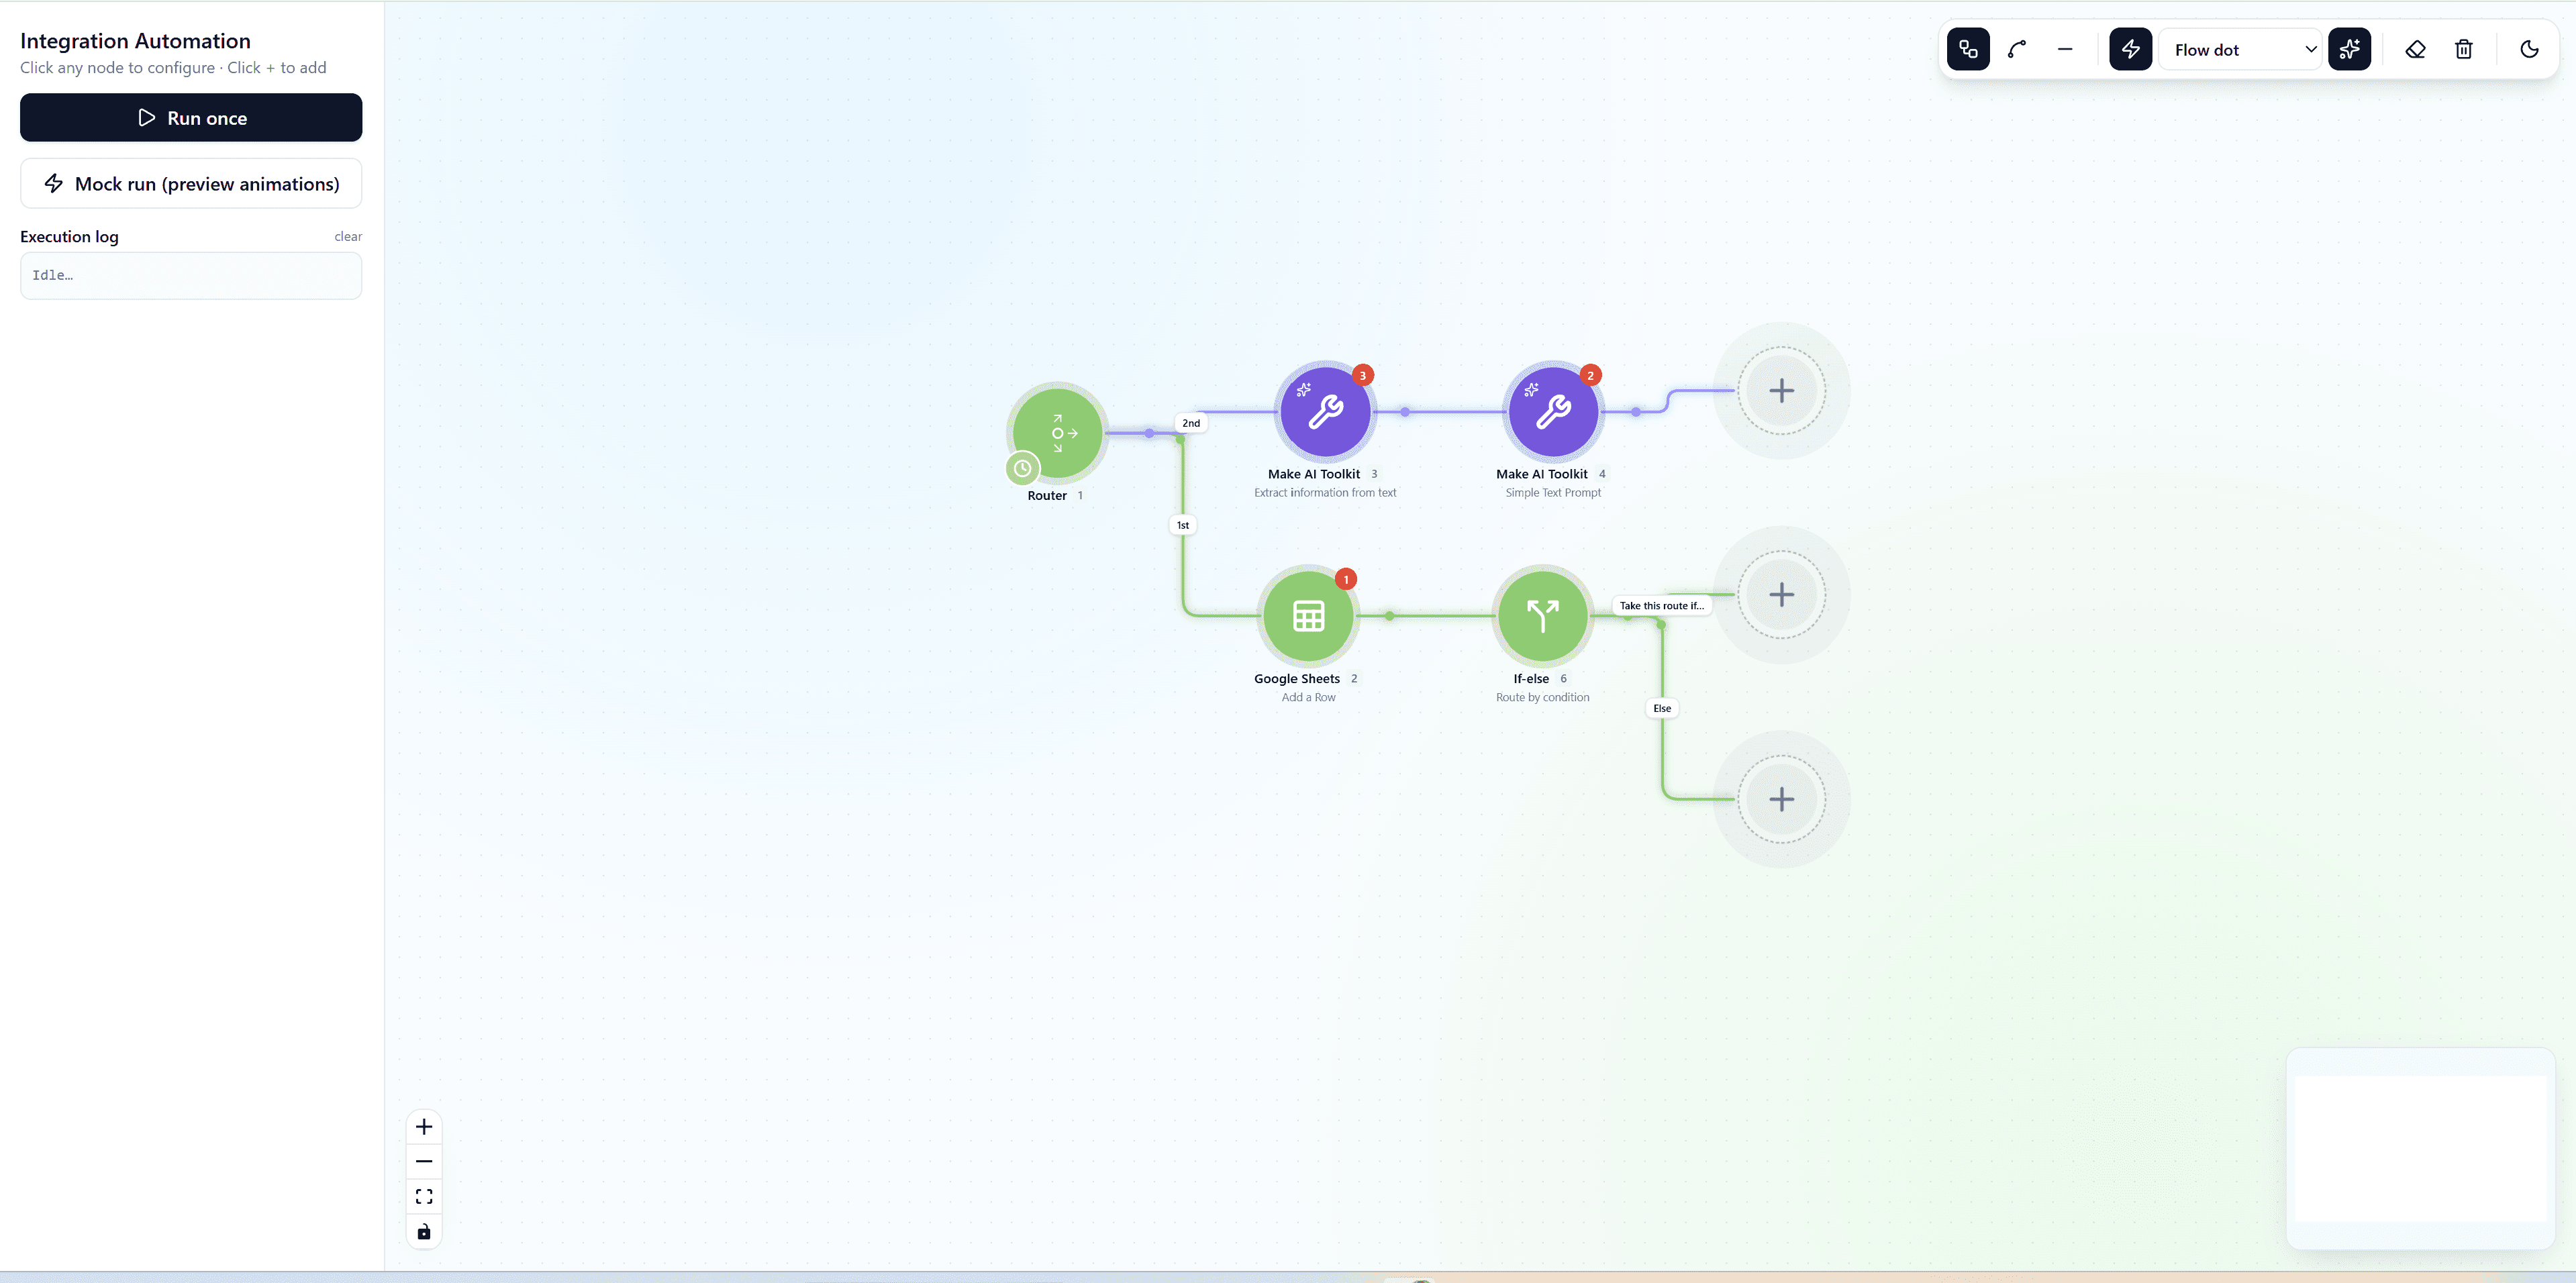
Pipeline Flow demonstrates how ReactFlow can be used to create powerful visualizations for data pipelines, ETL processes, and workflow automation systems. This comprehensive solution makes it easy to understand how data moves through different stages and transformations, helping teams visualize complex data processing workflows.
Understanding Data Pipelines
Data pipelines are sequences of data processing steps that transform raw data into usable information. They are fundamental to:
- ETL processes: Extract, Transform, Load operations
- Data engineering: Building data processing systems
- CI/CD workflows: Continuous integration and deployment pipelines
- Workflow automation: Automating business processes
- Data analytics: Processing data for analysis and reporting
Visualizing these pipelines helps teams:
- Understand data flow: See how data moves through systems
- Identify bottlenecks: Spot performance issues and optimization opportunities
- Document processes: Create clear documentation of data processing
- Debug issues: Quickly identify where problems occur
- Plan improvements: Design better pipeline architectures
Key Features
Pipeline Stages
Create custom node types for different pipeline stages:
- Extract: Data extraction from various sources
- Transform: Data transformation and cleaning operations
- Load: Loading data into target systems
- Validate: Data validation and quality checks
- Filter: Filtering and data selection
- Aggregate: Data aggregation and summarization
- Join: Combining data from multiple sources
Each stage type has:
- Custom styling: Visual distinction between stage types
- Configuration options: Stage-specific settings and parameters
- Status indicators: Real-time status and execution state
- Metadata display: Show stage properties and statistics
Data Flow Visualization
Visual representation of data flow includes:
- Directional edges: Arrows showing data flow direction
- Data volume indicators: Visual representation of data volume
- Transformation labels: Labels showing transformation operations
- Flow animation: Animated data flow during execution
Status Tracking
Real-time status updates show:
- Execution state: Running, completed, failed, pending
- Progress indicators: Percentage completion for long-running stages
- Error information: Error messages and failure details
- Performance metrics: Execution time and throughput statistics
- Data statistics: Record counts and data quality metrics
Custom Node Types
Create custom node types for specific operations:
// Example: Custom pipeline stage node
const PipelineStageNode = ({ data }) => {
  const statusColors = {
    pending: '#gray',
    running: '#blue',
    completed: '#green',
    failed: '#red',
  };

  return (
    <div className={`pipeline-node stage-${data.type}`}>
      <div className="stage-header">
        <span className="stage-icon">{getStageIcon(data.type)}</span>
        <span className="stage-name">{data.name}</span>
        <span
          className="status-indicator"
          style={{ backgroundColor: statusColors[data.status] }}
        />
      </div>
      <div className="stage-info">
        <div>Status: {data.status}</div>
        <div>Records: {data.recordCount}</div>
        <div>Duration: {data.duration}ms</div>
      </div>
    </div>
  );
};
Validation Rules
Built-in validation ensures:
- Logical correctness: Pipeline connections are valid
- Required stages: All required stages are present
- Data compatibility: Stage inputs/outputs are compatible
- Circular dependency detection: Prevents circular references
- Completeness checks: Ensures pipelines are complete
Implementation Details
Pipeline Definition
Define pipelines using a structured format:
interface PipelineStage {
  id: string;
  type: 'extract' | 'transform' | 'load' | 'validate' | 'filter' | 'aggregate';
  name: string;
  config: Record<string, any>;
  inputs: string[]; // Input stage IDs
  outputs: string[]; // Output stage IDs
  status: 'pending' | 'running' | 'completed' | 'failed';
  metadata: {
    recordCount?: number;
    duration?: number;
    error?: string;
  };
}

interface Pipeline {
  id: string;
  name: string;
  stages: PipelineStage[];
  edges: Edge[];
}
Stage Execution
Track stage execution:
// Example: Stage execution tracking
function executeStage(stage: PipelineStage, inputData: any) {
  stage.status = 'running';
  updatePipelineVisualization();

  try {
    const outputData = processStage(stage, inputData);
    stage.status = 'completed';
    stage.metadata.recordCount = outputData.length;
    stage.metadata.duration = Date.now() - stage.startTime;
    return outputData;
  } catch (error) {
    stage.status = 'failed';
    stage.metadata.error = error.message;
    throw error;
  } finally {
    updatePipelineVisualization();
  }
}
Data Flow Animation
Animate data flow through pipeline:
// Example: Animate data flow
function animateDataFlow(pipeline: Pipeline, data: any) {
  const stages = getExecutionOrder(pipeline.stages);

  stages.forEach((stage, index) => {
    setTimeout(() => {
      highlightStage(stage.id);
      const stageData = executeStage(stage, data);
      animateDataToNextStage(stage, stage.outputs, stageData);
      data = stageData;
    }, index * 1000);
  });
}
Use Cases
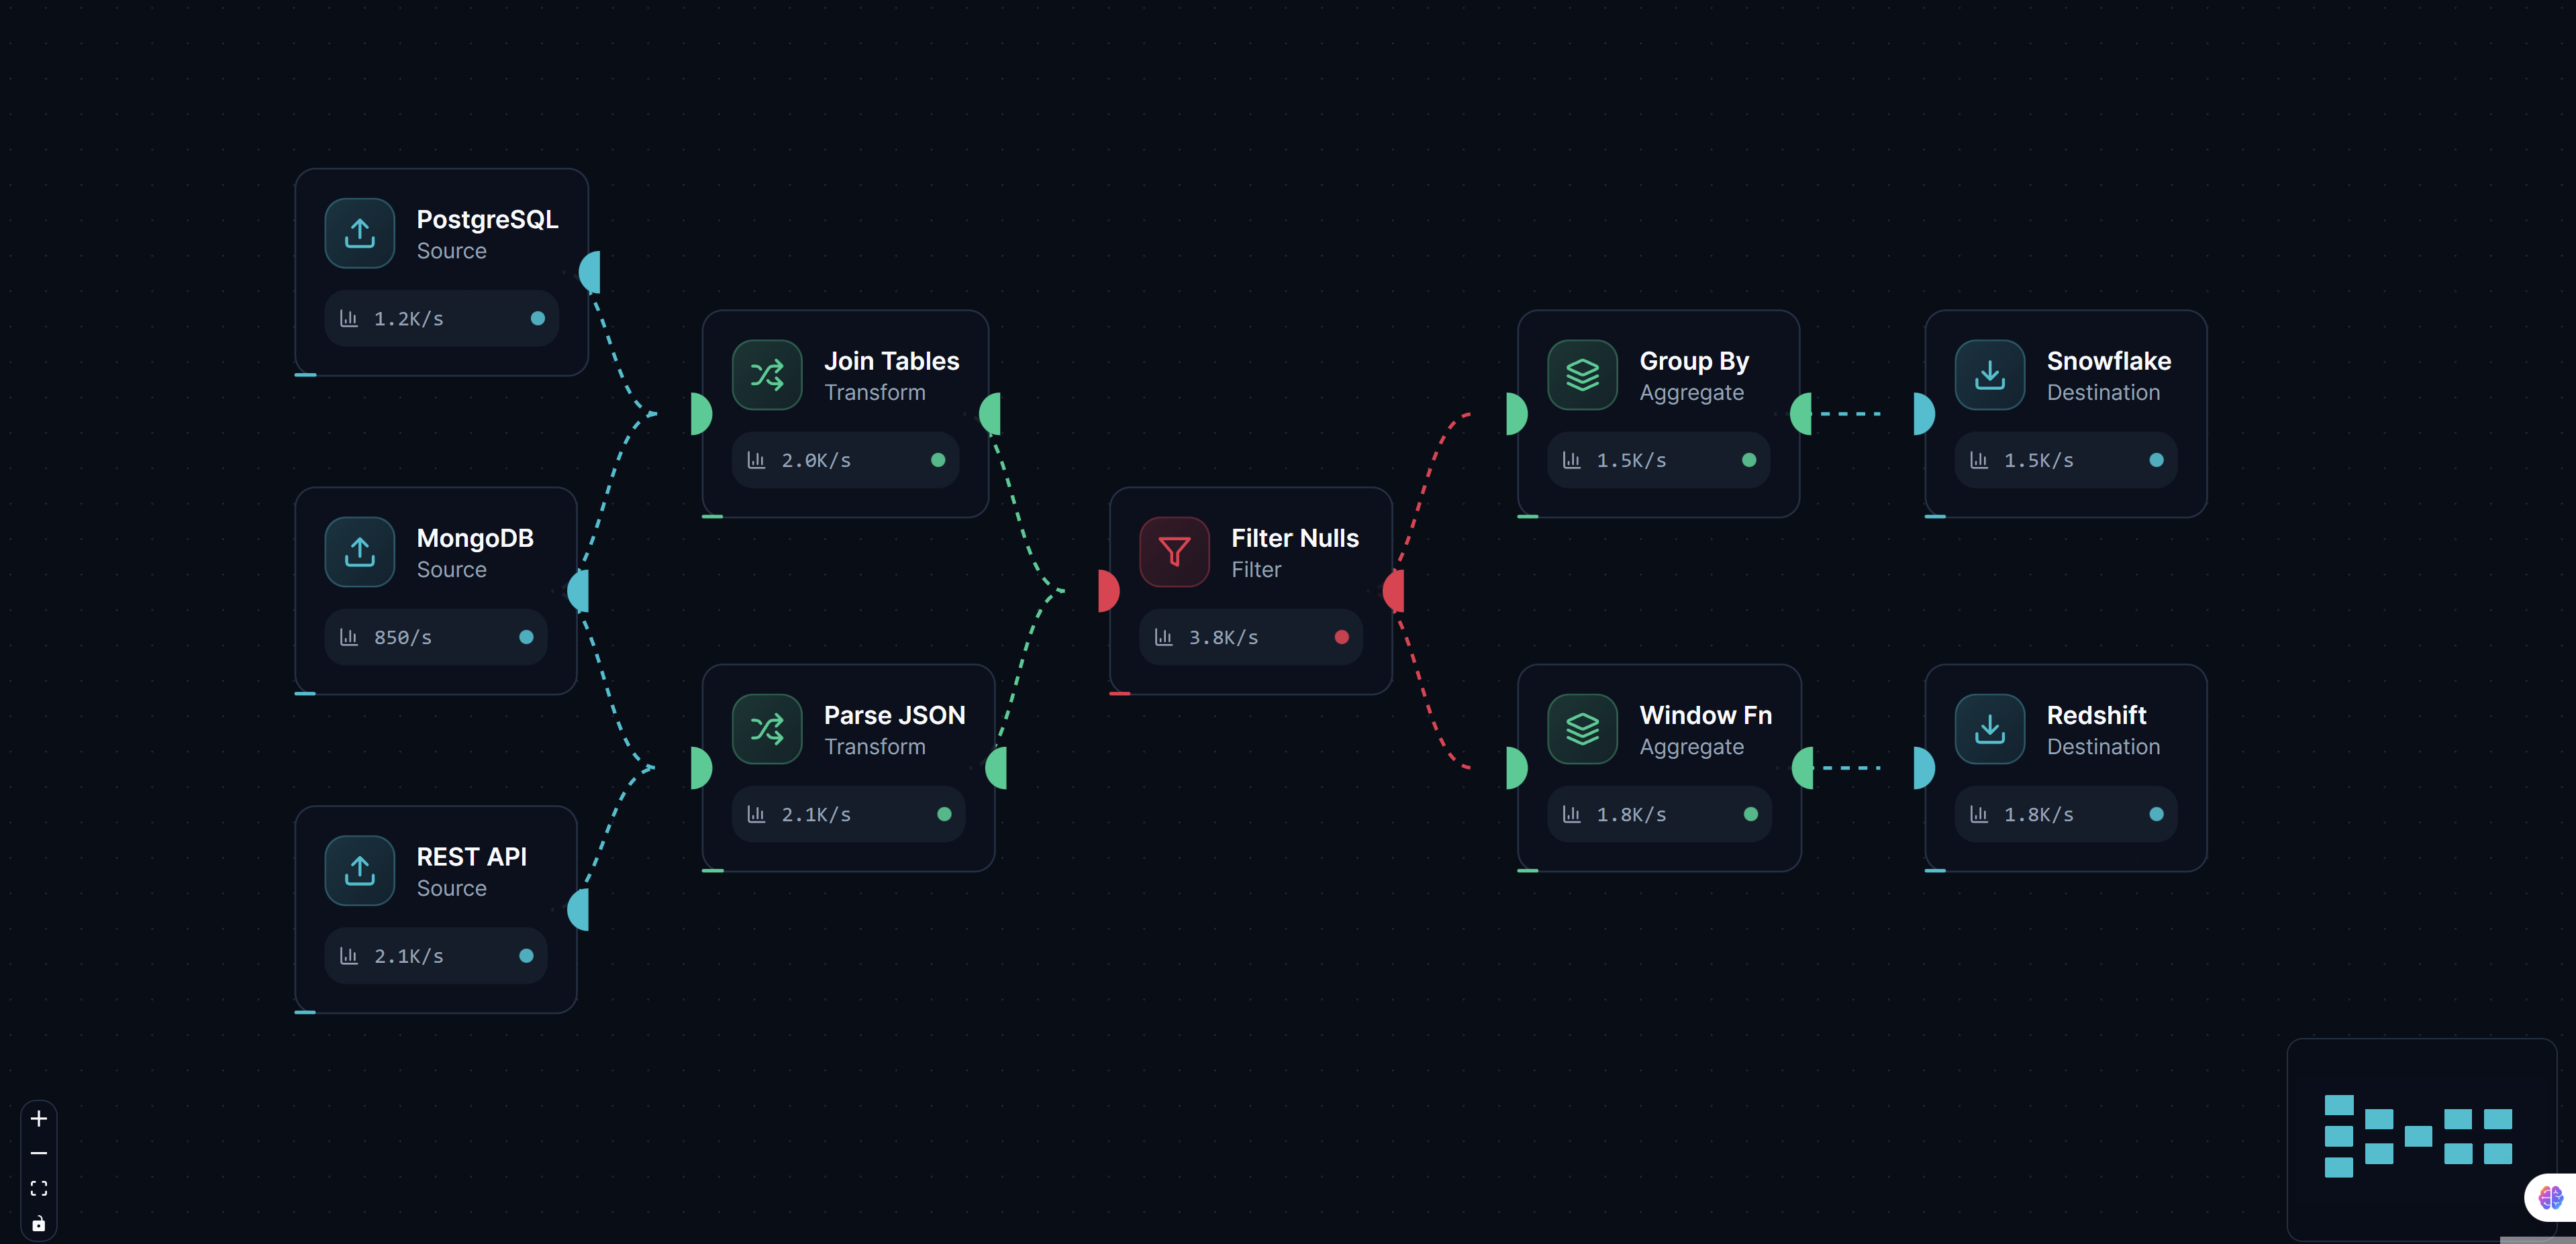
ETL Pipeline Visualization
Visualize Extract, Transform, Load processes:
- Data extraction: Show data sources and extraction methods
- Transformation steps: Visualize data cleaning and transformation
- Loading operations: Display target systems and loading methods
- Error handling: Show error handling and retry logic
CI/CD Workflow Design
Design and visualize CI/CD pipelines:
- Build stages: Visualize build and compilation steps
- Test stages: Show testing and quality assurance steps
- Deployment stages: Display deployment and release processes
- Notification stages: Show notification and alerting steps
Data Processing System Documentation
Document data processing systems:
- System architecture: Show overall system structure
- Data flow: Visualize how data moves through systems
- Processing logic: Document transformation and processing logic
- Integration points: Show system integration points
Workflow Automation Design
Design workflow automation:
- Process steps: Visualize automation process steps
- Decision points: Show decision logic and branching
- Integration points: Display external system integrations
- Error handling: Show error handling and recovery processes
Pipeline Monitoring Dashboards
Create monitoring dashboards:
- Real-time status: Show current pipeline execution status
- Performance metrics: Display performance and throughput metrics
- Error tracking: Track and display errors and failures
- Resource usage: Show resource consumption and utilization
Integration with Pipeline Tools
Apache Airflow
Integrate with Apache Airflow:
# Export Airflow DAG to visualization format
def export_dag_to_reactflow(dag):
    stages = []
    for task in dag.tasks:
        stages.append({
            'id': task.task_id,
            'type': get_task_type(task),
            'name': task.task_id,
            'config': task.params,
            'inputs': [dep.task_id for dep in task.upstream_list],
            'outputs': [dep.task_id for dep in task.downstream_list],
        })
    return {'stages': stages}
Prefect
Connect with Prefect workflows:
# Export Prefect flow to visualization
def export_prefect_flow(flow):
    stages = []
    for task in flow.tasks:
        stages.append({
            'id': task.name,
            'type': 'transform',  # Determine from task type
            'name': task.name,
            'inputs': [dep.name for dep in task.upstream_tasks],
            'outputs': [dep.name for dep in task.downstream_tasks],
        })
    return {'stages': stages}
Custom Pipeline Systems
Support custom pipeline formats:
{
  "pipeline": {
    "name": "Data Processing Pipeline",
    "stages": [
      {
        "id": "extract-1",
        "type": "extract",
        "name": "Extract from Database",
        "config": {
          "source": "postgresql",
          "query": "SELECT * FROM users"
        },
        "outputs": ["transform-1"]
      },
      {
        "id": "transform-1",
        "type": "transform",
        "name": "Clean Data",
        "config": {
          "operations": ["remove-nulls", "normalize"]
        },
        "inputs": ["extract-1"],
        "outputs": ["load-1"]
      },
      {
        "id": "load-1",
        "type": "load",
        "name": "Load to Warehouse",
        "config": {
          "target": "data-warehouse",
          "table": "users_cleaned"
        },
        "inputs": ["transform-1"]
      }
    ]
  }
}
Best Practices
Stage Organization
- Logical grouping: Group related stages together
- Clear naming: Use descriptive names for stages
- Consistent styling: Use consistent styling for stage types
- Proper spacing: Maintain adequate spacing between stages
Data Flow Clarity
- Directional indicators: Use clear arrows showing flow direction
- Volume indicators: Show data volume at each stage
- Transformation labels: Label transformations clearly
- Minimize crossings: Arrange stages to minimize edge crossings
Status Visualization
- Color coding: Use consistent colors for status types
- Progress indicators: Show progress for long-running stages
- Error highlighting: Clearly highlight errors and failures
- Real-time updates: Update status in real-time
Performance Optimization
- Efficient rendering: Optimize rendering for large pipelines
- Lazy loading: Load stage details on demand
- Caching: Cache pipeline definitions and status
- Virtualization: Use viewport virtualization for large pipelines
Benefits
Improved Understanding
- Visual clarity: See data flow and transformations clearly
- Better comprehension: Understand complex pipelines more easily
- Faster onboarding: New team members understand systems faster
- Clear documentation: Visual documentation is easier to follow
Better Debugging
- Quick identification: Quickly identify where issues occur
- Error visualization: See errors in context of pipeline flow
- Performance analysis: Identify performance bottlenecks visually
- Root cause analysis: Trace issues through pipeline stages
Enhanced Planning
- Design pipelines: Design new pipelines visually
- Optimize existing: Identify optimization opportunities
- Plan improvements: Plan pipeline improvements effectively
- Resource planning: Plan resource requirements accurately
Team Collaboration
- Shared understanding: Team members share common understanding
- Better communication: Communicate pipeline designs clearly
- Collaborative design: Design pipelines together visually
- Knowledge sharing: Share pipeline knowledge effectively
Conclusion
ReactFlow Pipeline Flow provides a powerful solution for visualizing data pipelines, ETL processes, and workflow automation systems. By making complex data processing workflows visual and interactive, this tool helps teams understand, document, and optimize their data pipelines.
Whether you're building ETL processes, designing CI/CD workflows, or documenting data processing systems, pipeline visualization provides invaluable insights into how data moves through your systems. The combination of custom stage types, status tracking, and validation creates a comprehensive tool for pipeline management.
Start visualizing your pipelines today and discover how interactive pipeline diagrams can transform your data engineering workflow.